【已解决】echarts的echarts怎么设置图例在下面且不和X轴数据重叠?
- echarts
- 时间:2023-06-07 14:45
- 5892人已阅读
简介
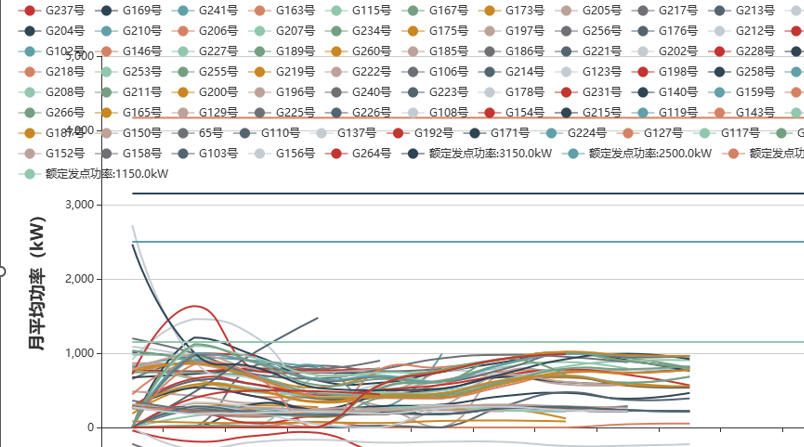
在使用echarts的时候,默认图例是在上面的。如果图例太多,会把下面数据覆盖掉的。如下图:要将 echarts 图例显示在下方,并避免和X轴数据重叠,可以使用 legend 组件中的一些属性和方法来设置。首先,需要将 legend 组件的 orient 属性设置为 'horizontal',
🔔🔔好消息!好消息!🔔🔔
有需要的朋友👉:微信号
在使用echarts的时候,默认图例是在上面的。如果图例太多,会把下面数据覆盖掉的。如下图:

要将 echarts 图例显示在下方,并避免和 X 轴数据重叠,可以使用 legend 组件中的一些属性和方法来设置。
首先,需要将 legend 组件的 orient 属性设置为 'horizontal',这样图例就会显示在 X 轴下方,在默认情况下会和 X 轴数据重叠。
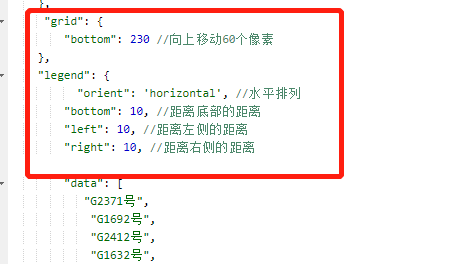
然后可以使用 grid 组件的 bottom 属性,将整个图表区域往上移一定距离,留出足够的空间给图例。
最后需要对图例的位置进行微调,可以使用 legend 组件中的 left、right 和 top 属性来调整图例的位置。

完整实例代码:
option = {
    grid: {
        bottom: 60 //向上移动60个像素
    },
    xAxis: {
        type: 'category',
        data: ['A', 'B', 'C', 'D', 'E']
    },
    yAxis: {
        type: 'value'
    },
    legend: {
        orient: 'horizontal', //水平排列
        bottom: 10, //距离底部的距离
        left: 10, //距离左侧的距离
        right: 10, //距离右侧的距离
        data: ['Series A', 'Series B', 'Series C', 'Series D', 'Series E']
    },
    series: [
        {
            name: 'Series A',
            type: 'bar',
            data: [120, 200, 150, 80, 70]
        },
        {
            name: 'Series B',
            type: 'bar',
            data: [90, 130, 178, 40, 60]
        },
        {
            name: 'Series C',
            type: 'bar',
            data: [57, 98, 137, 90, 150]
        },
        {
            name: 'Series D',
            type: 'bar',
            data: [88, 100, 122, 71, 60]
        },
        {
            name: 'Series E',
            type: 'bar',
            data: [97, 120, 85, 89, 111]
        }
    ]
};
测试地址:
https://echarts.apache.org/examples/zh/editor.html?c=line-simple